Average Elevation by State
Nearly every “average elevation by state” list you’ll find copies the same figures — an old federal table, rounded to the nearest hundred feet — and the copies don’t even agree with each other. It’s the same problem as our average elevation by country ranking, one country over.
So we computed it fresh: every state’s mean elevation from Copernicus GLO-30, the European Space Agency’s 30-metre satellite model, the same method for all 50 states. We also report the median — which the copied lists never do — and set our figure beside the old USGS one.
Below is a sortable table of all 50, our computed average next to the long-standing USGS number, plus the answer to a question the lists muddle: which is the “highest” state — the one with the tallest peak, or the one that sits highest on average?
- 1Colorado6,867 ft (2,093 m)
- 2Wyoming6,398 ft (1,950 m)
- 3Utah6,014 ft (1,833 m)
- 4New Mexico5,774 ft (1,760 m)
- 5Nevada5,528 ft (1,685 m)
- 6Idaho5,240 ft (1,597 m)
- 7Arizona4,216 ft (1,285 m)
- 8Montana4,137 ft (1,261 m)
- 9Hawaii3,904 ft (1,190 m)
- 10Oregon3,533 ft (1,077 m)
The highest states by average elevation
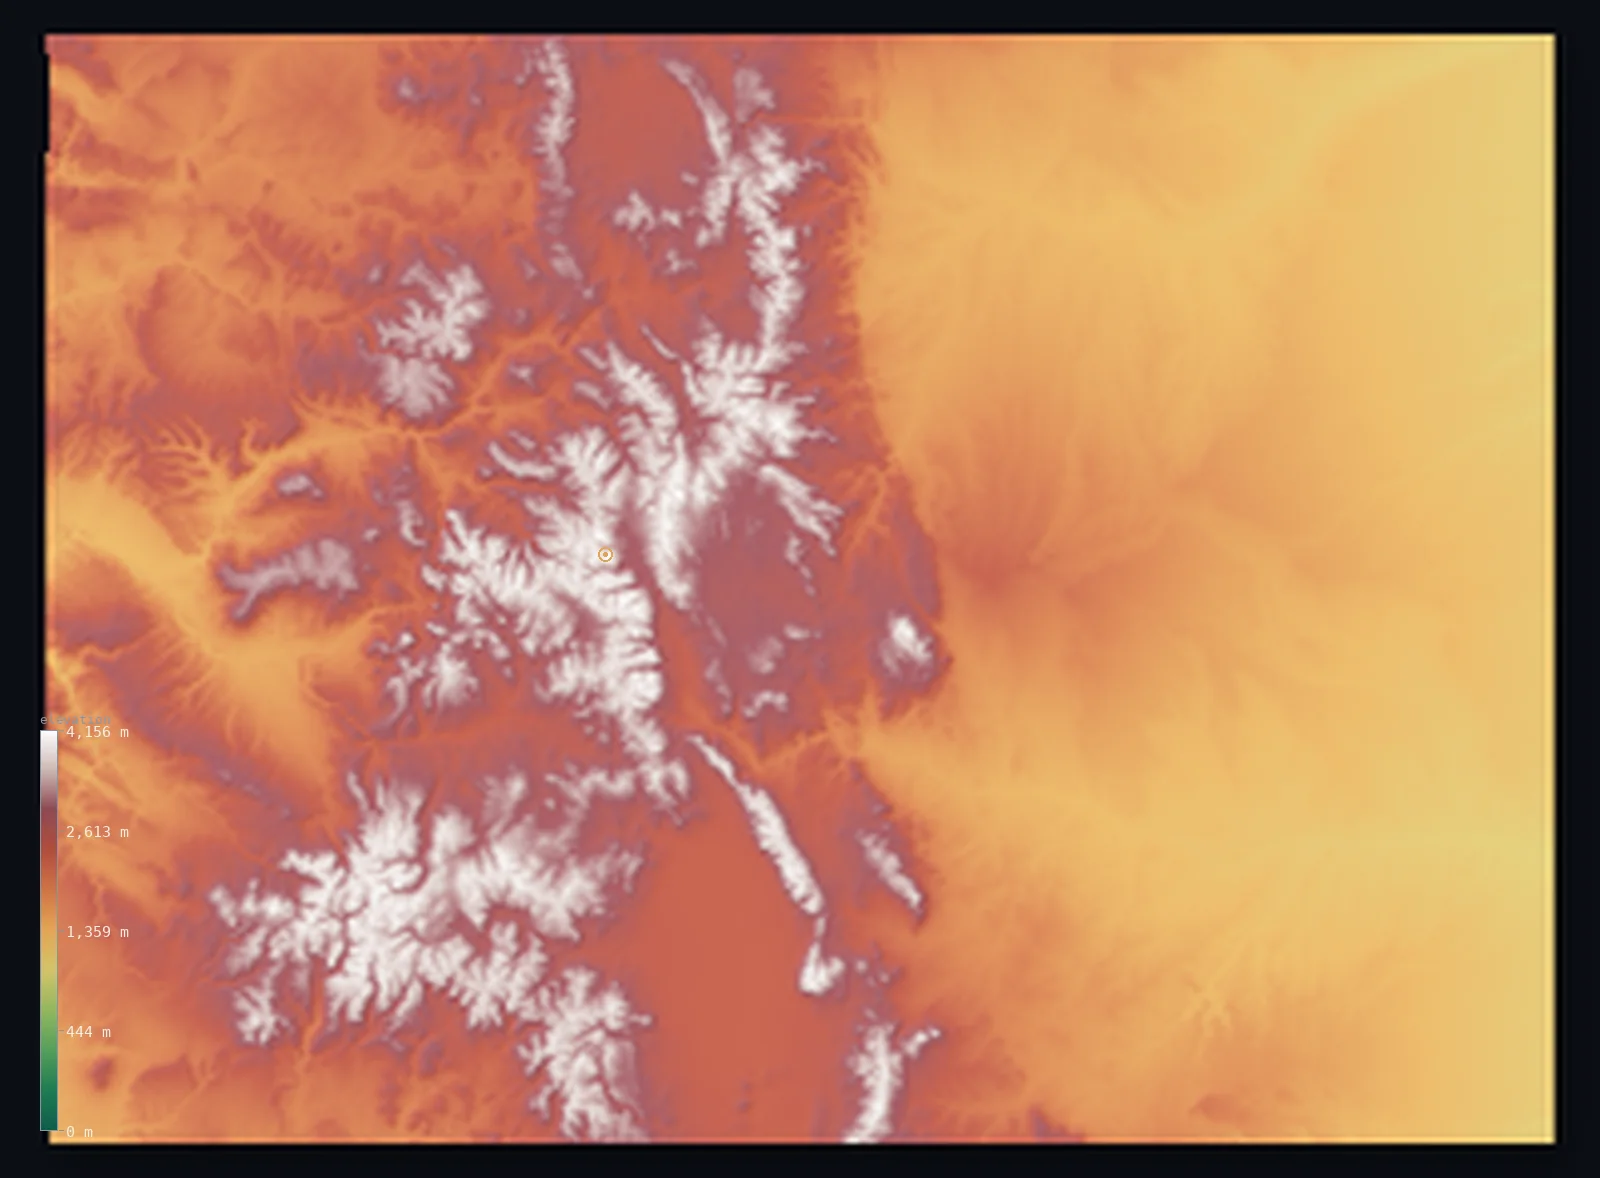
By average, the high ground is the Mountain West. Colorado leads at 6,867 ft (2,093 m) — not because of a single peak, but because almost the whole state sits high, from the mile-high plains in the east to the wall of Rockies in the west. Behind it come Wyoming (6,398 ft (1,950 m)), Utah (6,014 ft (1,833 m)) and New Mexico (5,774 ft (1,760 m)).
These are the states of the Rockies and the Great Basin, where the land is broadly elevated rather than spiked. It’s the same pattern as the world’s most mountainous countries: a high average comes from high ground, not just a high point.
Highest state: Alaska or Colorado?
It depends what you mean by “highest,” and the two answers point at different states. Alaska has the highest point — Denali rises to 20,308 ft (6,190 m), the tallest mountain in North America. But Alaska’s average elevation is only 1,496 ft (456 m), which ranks it 19th, because its vast coastal plains, river deltas and tundra sit near sea level.
Colorado is the opposite: no single Colorado peak is as tall as Denali, but the state as a whole sits higher than any other, so it wins on average. That is the crux of the confusion — “highest state” by peak is Alaska, by average is Colorado, and both are right for their own measure. (For the difference between a high point and a high place, see elevation vs altitude.)
The lowest states
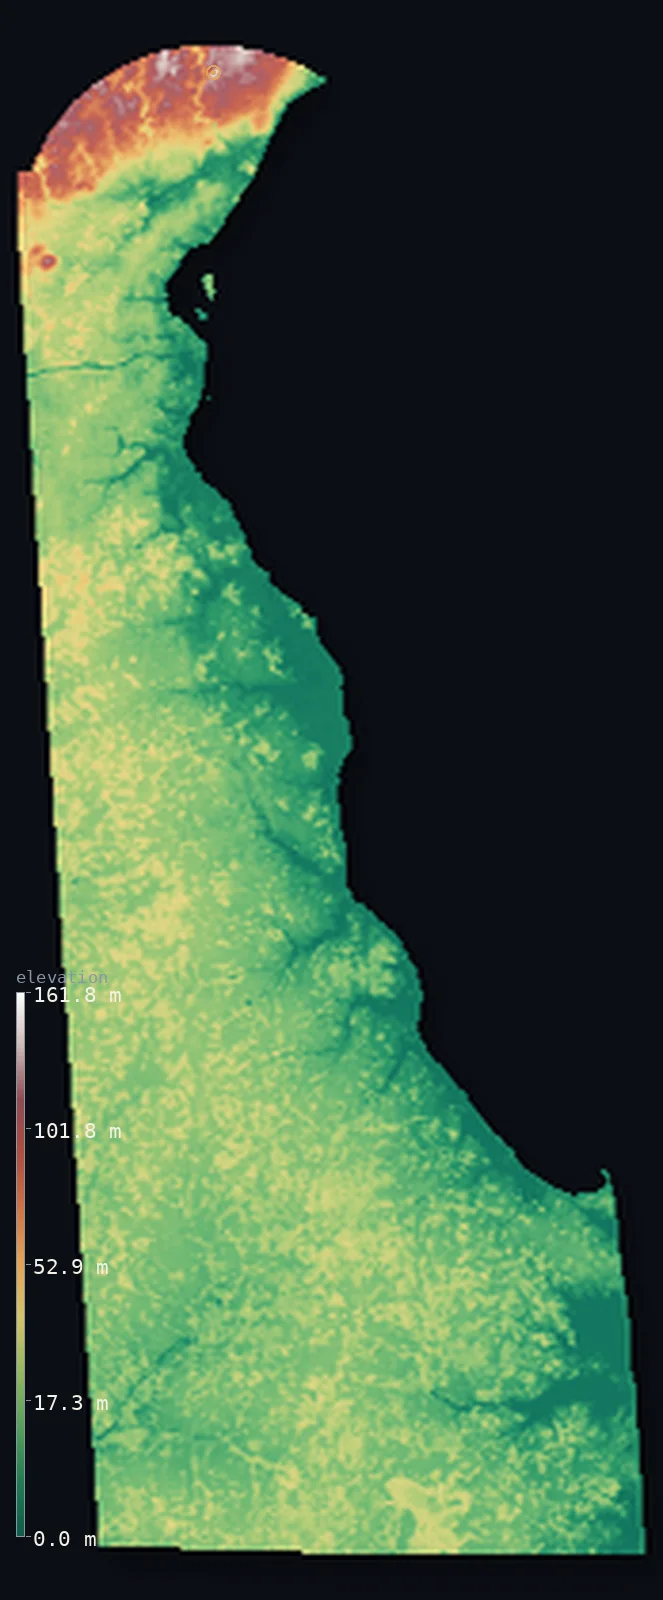
At the other end are the coastal-plain states. Delaware averages just 61 ft (18.5 m) — its highest point, Ebright Azimuth, reaches only 449 ft (137 m) — followed by Florida (70 ft (21.3 m)) and Louisiana (108 ft (32.8 m)). These are the flattest, lowest states, hugging the Atlantic and Gulf coasts.
Their low average is also why they feel sea-level rise most directly: Florida and Louisiana have large populations living within a few metres of the tide. A low mean is a coastal-exposure number as much as a geographic one.
Mean vs median by state
As with countries, the mean can flatter a state, which is why we compute the median too — the elevation with half the land above it and half below. When the mean sits well above the median, a small patch of high mountains is dragging the average up.
Hawaii is a clear case: a mean of 3,904 ft (1,190 m) over a median of 3,307 ft (1,008 m), because its volcanoes tower over low coastal land. Alaska shows the same split (mean 1,496 ft (456 m), median 961 ft (293 m)). At the top, Colorado and Wyoming are so uniformly high that their mean and median nearly match — a sign the whole state is elevated, not just its peaks.
Why our figures differ from the old USGS numbers
The state figures everyone quotes trace back to one source: a decades-old US Geological Survey table, reported to the nearest hundred feet. For most states our computation lands close to it — Coloradoat 6,867 ft (2,093 m) against the USGS 6,791 ft (2,070 m) — but for others the gap is real.
We compute Washington at 2,290 ft (698 m) against a cited 1,706 ft (520 m), and Hawaii at 3,904 ft (1,190 m) against 3,051 ft (930 m). The differences come from method and era: the old figures were estimated from sparse spot heights decades ago, while ours reads every 30-metre cell of a modern satellite model, the same way for all 50 states. All 50 states carry the USGS figure in the table for comparison.
All 50 states, ranked
Sort by our average, the USGS figure, the median, or the highest point. Each state links to its full interactive 3D elevation map.
| # | |||||
|---|---|---|---|---|---|
| 1 | Colorado | 6,867 ft (2,093 m) | 6,791 ft (2,070 m) | 6,542 ft (1,994 m) | Mount Elbert 14,439 ft (4,401 m) |
| 2 | Wyoming | 6,398 ft (1,950 m) | 6,693 ft (2,040 m) | 6,549 ft (1,996 m) | Gannett Peak 13,809 ft (4,209 m) |
| 3 | Utah | 6,014 ft (1,833 m) | 6,102 ft (1,860 m) | 5,676 ft (1,730 m) | Kings Peak 13,517 ft (4,120 m) |
| 4 | New Mexico | 5,774 ft (1,760 m) | 5,709 ft (1,740 m) | 5,689 ft (1,734 m) | Wheeler Peak 13,166 ft (4,013 m) |
| 5 | Nevada | 5,528 ft (1,685 m) | 5,512 ft (1,680 m) | 5,620 ft (1,713 m) | Boundary Peak 13,140 ft (4,005 m) |
| 6 | Idaho | 5,240 ft (1,597 m) | 4,987 ft (1,520 m) | 5,177 ft (1,578 m) | Borah Peak 12,661 ft (3,859 m) |
| 7 | Arizona | 4,216 ft (1,285 m) | 4,101 ft (1,250 m) | 4,596 ft (1,401 m) | Humphreys Peak 12,638 ft (3,852 m) |
| 8 | Montana | 4,137 ft (1,261 m) | 3,412 ft (1,040 m) | 3,599 ft (1,097 m) | Granite Peak 12,808 ft (3,904 m) |
| 9 | Hawaii | 3,904 ft (1,190 m) | 3,051 ft (930 m) | 3,307 ft (1,008 m) | Mauna Kea 13,796 ft (4,205 m) |
| 10 | Oregon | 3,533 ft (1,077 m) | 3,281 ft (1,000 m) | 4,039 ft (1,231 m) | Mount Hood 11,250 ft (3,429 m) |
| 11 | California | 2,802 ft (854 m) | 2,887 ft (880 m) | 2,300 ft (701 m) | Mount Whitney 14,505 ft (4,421 m) |
| 12 | Nebraska | 2,605 ft (794 m) | 2,592 ft (790 m) | 2,480 ft (756 m) | Panorama Point 5,423 ft (1,653 m) |
| 13 | Washington | 2,290 ft (698 m) | 1,706 ft (520 m) | 2,080 ft (634 m) | Mount Rainier 14,409 ft (4,392 m) |
| 14 | South Dakota | 2,185 ft (666 m) | 2,198 ft (670 m) | 1,932 ft (589 m) | Black Elk Peak 7,241 ft (2,207 m) |
| 15 | Kansas | 1,909 ft (582 m) | 2,001 ft (610 m) | 1,660 ft (506 m) | Mount Sunflower 4,042 ft (1,232 m) |
| 16 | North Dakota | 1,827 ft (557 m) | 1,903 ft (580 m) | 1,841 ft (561 m) | White Butte 3,507 ft (1,069 m) |
| 17 | West Virginia | 1,699 ft (518 m) | 1,509 ft (460 m) | 1,430 ft (436 m) | Spruce Knob 4,862 ft (1,482 m) |
| 18 | Texas | 1,657 ft (505 m) | 1,706 ft (520 m) | 1,332 ft (406 m) | Guadalupe Peak 8,750 ft (2,667 m) |
| 19 | Alaska | 1,496 ft (456 m) | 1,903 ft (580 m) | 961 ft (293 m) | Denali 20,308 ft (6,190 m) |
| 20 | Oklahoma | 1,293 ft (394 m) | 984 ft (300 m) | 1,066 ft (325 m) | Black Mesa 4,974 ft (1,516 m) |
| 21 | Pennsylvania | 1,270 ft (387 m) | 1,115 ft (340 m) | 1,273 ft (388 m) | Mount Davis 3,212 ft (979 m) |
| 22 | Vermont | 1,234 ft (376 m) | 984 ft (300 m) | 1,224 ft (373 m) | Mount Mansfield 4,393 ft (1,339 m) |
| 23 | Minnesota | 1,220 ft (372 m) | 1,214 ft (370 m) | 1,211 ft (369 m) | Eagle Mountain 2,300 ft (701 m) |
| 24 | New Hampshire | 1,152 ft (351 m) | 984 ft (300 m) | 1,027 ft (313 m) | Mount Washington 6,289 ft (1,917 m) |
| 25 | New York | 1,125 ft (343 m) | 984 ft (300 m) | 1,142 ft (348 m) | Mount Marcy 5,344 ft (1,629 m) |
| 26 | Wisconsin | 1,093 ft (333 m) | 1,050 ft (320 m) | 1,033 ft (315 m) | Timms Hill 1,952 ft (595 m) |
| 27 | Iowa | 1,066 ft (325 m) | 1,115 ft (340 m) | 1,086 ft (331 m) | Hawkeye Point 1,670 ft (509 m) |
| 28 | Virginia | 1,010 ft (308 m) | 951 ft (290 m) | 604 ft (184 m) | Mount Rogers 5,728 ft (1,746 m) |
| 29 | Tennessee | 965 ft (294 m) | 886 ft (270 m) | 827 ft (252 m) | Clingmans Dome 6,644 ft (2,025 m) |
| 30 | Ohio | 935 ft (285 m) | 853 ft (260 m) | 942 ft (287 m) | Campbell Hill 1,549 ft (472 m) |
| 31 | Michigan | 912 ft (278 m) | 886 ft (270 m) | 850 ft (259 m) | Mount Arvon 1,978 ft (603 m) |
| 32 | Missouri | 860 ft (262 m) | 787 ft (240 m) | 856 ft (261 m) | Taum Sauk Mountain 1,772 ft (540 m) |
| 33 | Kentucky | 840 ft (256 m) | 755 ft (230 m) | 804 ft (245 m) | Black Mountain 4,144 ft (1,263 m) |
| 34 | Maine | 771 ft (235 m) | 591 ft (180 m) | 636 ft (194 m) | Mount Katahdin 5,269 ft (1,606 m) |
| 35 | North Carolina | 771 ft (235 m) | 689 ft (210 m) | 358 ft (109 m) | Mount Mitchell 6,683 ft (2,037 m) |
| 36 | Indiana | 751 ft (229 m) | 689 ft (210 m) | 768 ft (234 m) | Hoosier Hill 1,257 ft (383 m) |
| 37 | Illinois | 627 ft (191 m) | 591 ft (180 m) | 636 ft (194 m) | Charles Mound 1,234 ft (376 m) |
| 38 | Massachusetts | 558 ft (170 m) | 492 ft (150 m) | 328 ft (100 m) | Mount Greylock 3,488 ft (1,063 m) |
| 39 | Arkansas | 541 ft (165 m) | 656 ft (200 m) | 338 ft (103 m) | Magazine Mountain 2,753 ft (839 m) |
| 40 | Georgia | 522 ft (159 m) | 591 ft (180 m) | 364 ft (111 m) | Brasstown Bald 4,783 ft (1,458 m) |
| 41 | Connecticut | 489 ft (149 m) | 492 ft (150 m) | 430 ft (131 m) | Mount Frissell (south slope) 2,379 ft (725 m) |
| 42 | Alabama | 476 ft (145 m) | 492 ft (150 m) | 410 ft (125 m) | Cheaha Mountain 2,411 ft (735 m) |
| 43 | Maryland | 429 ft (131 m) | 361 ft (110 m) | 159 ft (48.6 m) | Hoye-Crest (Backbone Mountain) 3,360 ft (1,024 m) |
| 44 | South Carolina | 341 ft (104 m) | 361 ft (110 m) | 233 ft (71 m) | Sassafras Mountain 3,560 ft (1,085 m) |
| 45 | Mississippi | 305 ft (92.9 m) | 295 ft (90 m) | 311 ft (94.9 m) | Woodall Mountain 807 ft (246 m) |
| 46 | Rhode Island | 270 ft (82.2 m) | 197 ft (60 m) | 235 ft (71.7 m) | Jerimoth Hill 810 ft (247 m) |
| 47 | New Jersey | 240 ft (73.3 m) | 262 ft (80 m) | 112 ft (34 m) | High Point 1,804 ft (550 m) |
| 48 | Louisiana | 108 ft (32.8 m) | 98 ft (30 m) | 76 ft (23.1 m) | Driskill Mountain 535 ft (163 m) |
| 49 | Florida | 70 ft (21.3 m) | 98 ft (30 m) | 57 ft (17.4 m) | Britton Hill 344 ft (105 m) |
| 50 | Delaware | 61 ft (18.5 m) | 59 ft (18 m) | 49 ft (15 m) | Ebright Azimuth 449 ft (137 m) |
Highest by average: Colorado, 6,867 ft (2,093 m) — the whole state sits high, not just its peaks.
From Colorado (6,867 ft (2,093 m)) to Delaware (61 ft (18.5 m)), the 50 states span more than 2,000 m of average elevation.
See any state in 3D
Every row links to that state’s interactive elevation map — spin the terrain, tap for the height, and see where the average comes from. Start with Colorado, the highest by average, or browse all fifty on the US states index.
Frequently asked questions
- What is the highest state?
- It depends on the measure. By highest point, Alaska (Denali, 20,308 ft (6,190 m)); by average elevation, Colorado (6,867 ft (2,093 m)). Both are correct for what they measure.
- Is Alaska or Colorado the highest state?
- Alaska has the tallest mountain (Denali) but only a middling average, because so much of it is low coast and tundra. Colorado has the highest average — the whole state sits high — so it’s “highest” by that measure.
- What is the lowest state?
- Delaware, at about 61 ft (18.5 m) average elevation, followed by Floridaand Louisiana — the low coastal-plain states.
- What is the average elevation of the United States?
- Averaging the 50 states equally, about 1,848 ft (563 m) by our GLO-30 computation. (That’s the mean of the state means, not an area-weighted national figure.)
- Why do sources give different state elevations?
- Most copy one old, rounded USGS table, and the copies drift. We compute every state the same way from a modern satellite model, so the 50 figures are actually comparable.
Sources
Each state’s mean and median are computed here from Copernicus GLO-30 (ESA, 2021 release), clipped to the state outline — the same first-party method as the country version and the methodology page. The comparison figure in the table is the long-standing USGS mean elevation for each state, and the highest and lowest points are the researched values in our state dossiers. State statistics current as of 2026-07-14; built by Marko Visic.
Related
- · Average elevation by country — the sibling ranking for all 194 countries.
- · The flattest states in the US — the same 50 states ranked by whole-state flatness, and the Kansas pancake myth resolved with our data.
- · Most mountainous countries — high average vs high peak, at country scale.
- · Elevation vs altitude — what “average elevation” measures.
- · All 50 US state maps — the interactive index.
- · More elevation deep-dives — the blog.
State averages computed by 3D Elevation Map from Copernicus GLO-30 (ESA), 2026-07-14; USGS comparison figures and state high/low points as cited. Built by Marko Visic.