Illinois Elevation Map
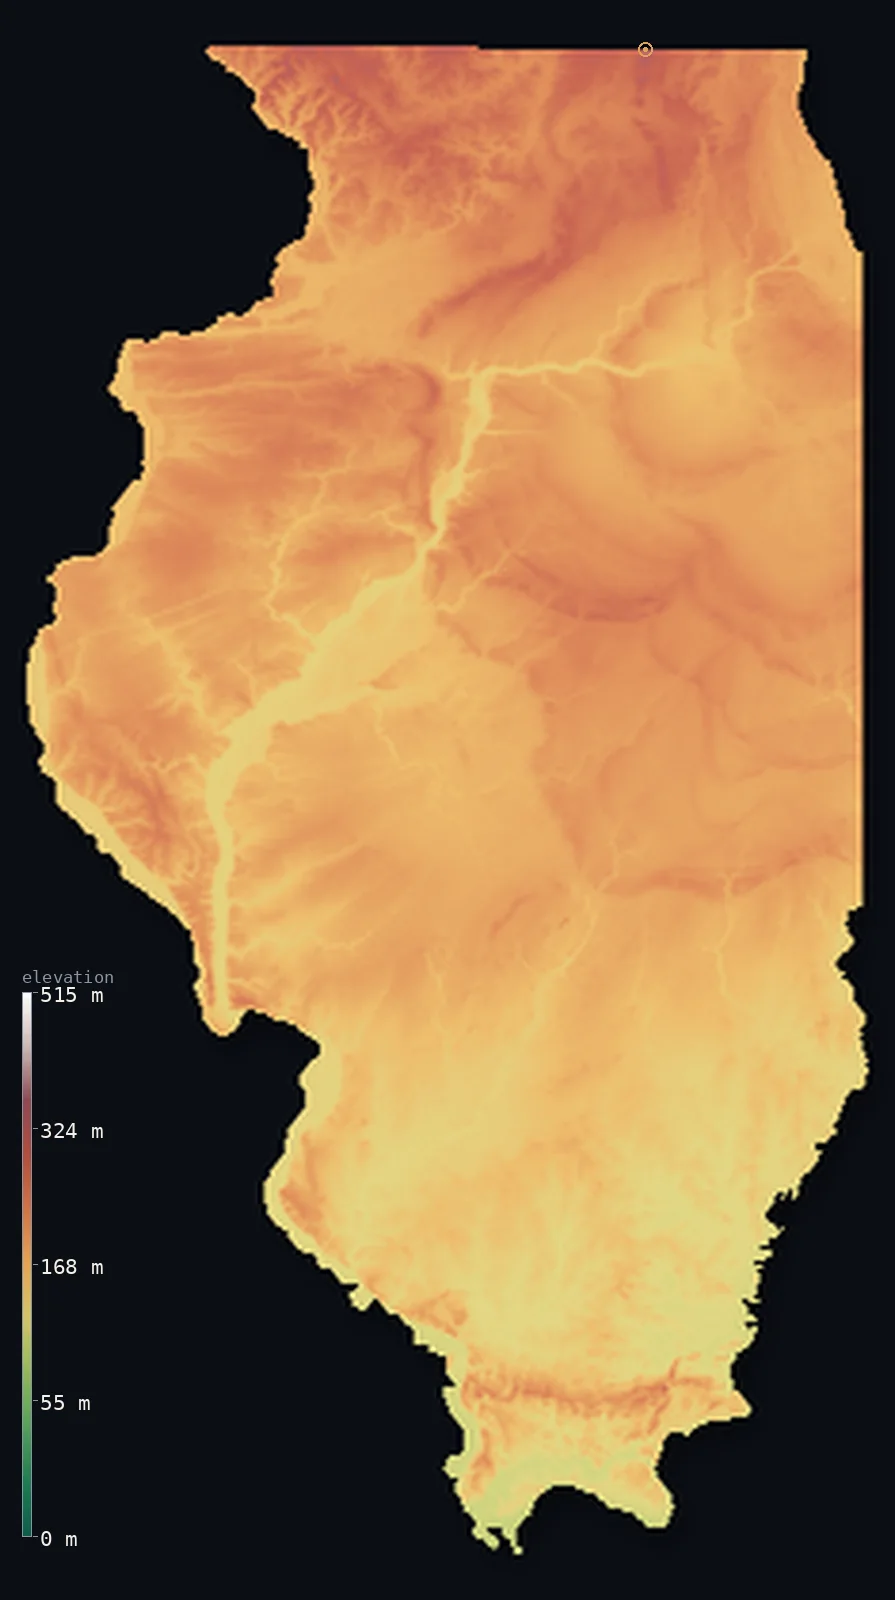
Illinois’s highest point is Charles Mound at 1,234 ft (376 m); its lowest is Mississippi River at 279 ft (85 m); the mean elevation is 627 ft (191 m).
- Highest point📚
- 1,234 ft376 m
- Charles Mound.
- Lowest point📚
- 279 ft85 m
- Mississippi River.
- Mean elevation⚙
- 627 ft191 m
- Computed from the GLO-30 surface model.
- Median elevation⚙
- 636 ft194 m
- Half of Illinois lies below this height.
- Elevation range📚
- 955 ft291 m
- From 85 m to Charles Mound's 376 m.
- Official area📚
- 57,913 mi²149,995 km²
- Illinois.
Illinois at a glance
Charles Mound, the high point, sits on private land and is open to visitors only a few days each year.
source ↗Most of Illinois is glacier-flattened prairie, some of the most fertile farmland on the planet.
source ↗Both the far northwest and far south of Illinois escaped the last glaciers, keeping their hills.
source ↗The southern tip of Illinois at Cairo is farther south than Richmond, Virginia.
source ↗Illinois's whole relief spans under 300 m across its entire length.
source ↗
Elevation profile of Illinois
The largest share of land, 26%, falls in the 175–200 m band, and 100% of the territory lies below 500 m (1,640 ft).
- below 500 m (1,640 ft)100%
Highest and lowest points
The highest point of Illinois, Charles Mound, 376 m, a gentle rise in the Driftless Area of the far northwest corner - one of the few patches of Illinois the glaciers never flattened, sitting on private land opened only a few days a year.
source ↗Highest peaks of Illinois
| Peak | Elevation | Range | Note |
|---|---|---|---|
| Charles Mound↗ | 1,234 ft376 m | Driftless Area | Highest point of Illinois, in the unglaciated northwest. |
| Scales Mound↗ | 1,214 ft370 m | Driftless Area | A high mound near Charles Mound in the Driftless corner. |
| Benton high ground↗ | 1,181 ft360 m | Driftless Area | High rolling ground of the northwest. |
| Shawnee Hills highpoint↗ | 1,050 ft320 m | Shawnee Hills | High ground of the unglaciated far south. |
| Williams Hill↗ | 1,050 ft320 m | Shawnee Hills | The high point of the southern Shawnee Hills. |
Terrain regions of Illinois
Charles Mound, the high point, sits on private land and is open to visitors only a few days each year. ↗
The Driftless northwest
↗The far northwestern corner of Illinois is part of the Driftless Area, a region the glaciers missed. Instead of the flat plains that cover the rest of the state
The central till prairie
↗Almost all of Illinois is flat to gently rolling till plain - the Grand Prairie, flattened and deep-soiled by the glaciers into some of the most productive farm
The southern hills and river lowlands
↗Southern Illinois, below the glacial limit, holds the rugged forested Shawnee Hills, and the state is framed by great rivers - the Mississippi on the west, the
The Driftless northwest
the far northwestThe far northwestern corner of Illinois is part of the Driftless Area, a region the glaciers missed. Instead of the flat plains that cover the rest of the state, it keeps low higher rolling ground ground, rising to Charles Mound (376 m), the state's highest point, near the Wisconsin line.
The central till prairie
most of the stateAlmost all of Illinois is flat to gently rolling till plain - the Grand Prairie, flattened and deep-soiled by the glaciers into some of the most productive farmland on Earth. Level horizons of corn and soybeans stretch across the heart of the state, barely varying in height.
The southern hills and river lowlands
the south and riversSouthern Illinois, below the glacial limit, holds the rugged forested Shawnee Hills, and the state is framed by great rivers - the Mississippi on the west, the Ohio on the southeast - dropping to the state's lowest point at their confluence at Cairo, just 85 m.
City elevations in Illinois
| City | Population | Elevation |
|---|---|---|
| Chicago | 2,664,452 | 587 ft179 m |
| Aurora | 200,661 | 679 ft207 m |
| Rockford | 148,278 | 725 ft221 m |
| Peoria | 115,070 | 502 ft153 m |
| Springfield | 114,394 | 604 ft184 m |
| Davenport | 102,582 | 597 ft182 m |
| Waukegan | 88,475 | 659 ft201 m |
| Champaign | 86,096 | 745 ft227 m |
| Bloomington | 78,292 | 801 ft244 m |
| Decatur | 73,254 | 676 ft206 m |
Elevation sampled at each city centre from the Copernicus GLO-30 model. Cities and population from GeoNames (CC-BY 4.0).
Illinois in comparison
Illinois's terrain rises 955 ft (291 m) from Mississippi River (279 ft (85 m)) to Charles Mound — about 3% of the height of Mount Everest, the world's highest point at 29,032 ft (8,849 m).
Frequently asked questions
What is the highest point in Illinois?
- Charles Mound, 1,234 ft (376 m).
What is the average elevation of Illinois?
- About 180 m according to the USGS; this page also reports the area-weighted mean computed from the Copernicus GLO-30 model, 627 ft (191 m).
What is the lowest point in Illinois?
- Mississippi River, 279 ft (85 m).
Charles Mound?
- Charles Mound, the high point, sits on private land and is open to visitors only a few days each year.
Where is the highest ground in Illinois?
- The far northwestern corner of Illinois is part of the Driftless Area, a region the glaciers missed. Instead of the flat plains that cover the rest of the state, it keeps low rolling ground and higher grou
Is this a topographic, relief, contour, or elevation map of Illinois?
- They describe the same thing - terrain height. This page renders Illinois's actual elevation surface in interactive 3D (a relief or topographic view) and reports the statistics computed from it; a contour map shows the same data as lines of equal height.
About this map
The terrain is rendered from the Copernicus GLO-30 digital elevation model (ESA), masked to the US-IL boundary from geoBoundaries (gbOpen). Elevation statistics are computed directly from the model; peak names and researched facts are sourced and cited. See the methodology for the full pipeline.
Our area-weighted mean, computed from the Copernicus GLO-30 model, is 627 ft (191 m); the figure commonly cited elsewhere is 591 ft (180 m) (U.S. Geological Survey). Illinois's mean elevation is about 180 m; the page reports the area-weighted figure computed from the Copernicus GLO-30 model.
Surveyed national figures: official area · high point.
Rendered from Copernicus GLO-30 (ESA, 2021 release), boundaries from geoBoundaries. Generated 2026-07-14.