Ohio Elevation Map
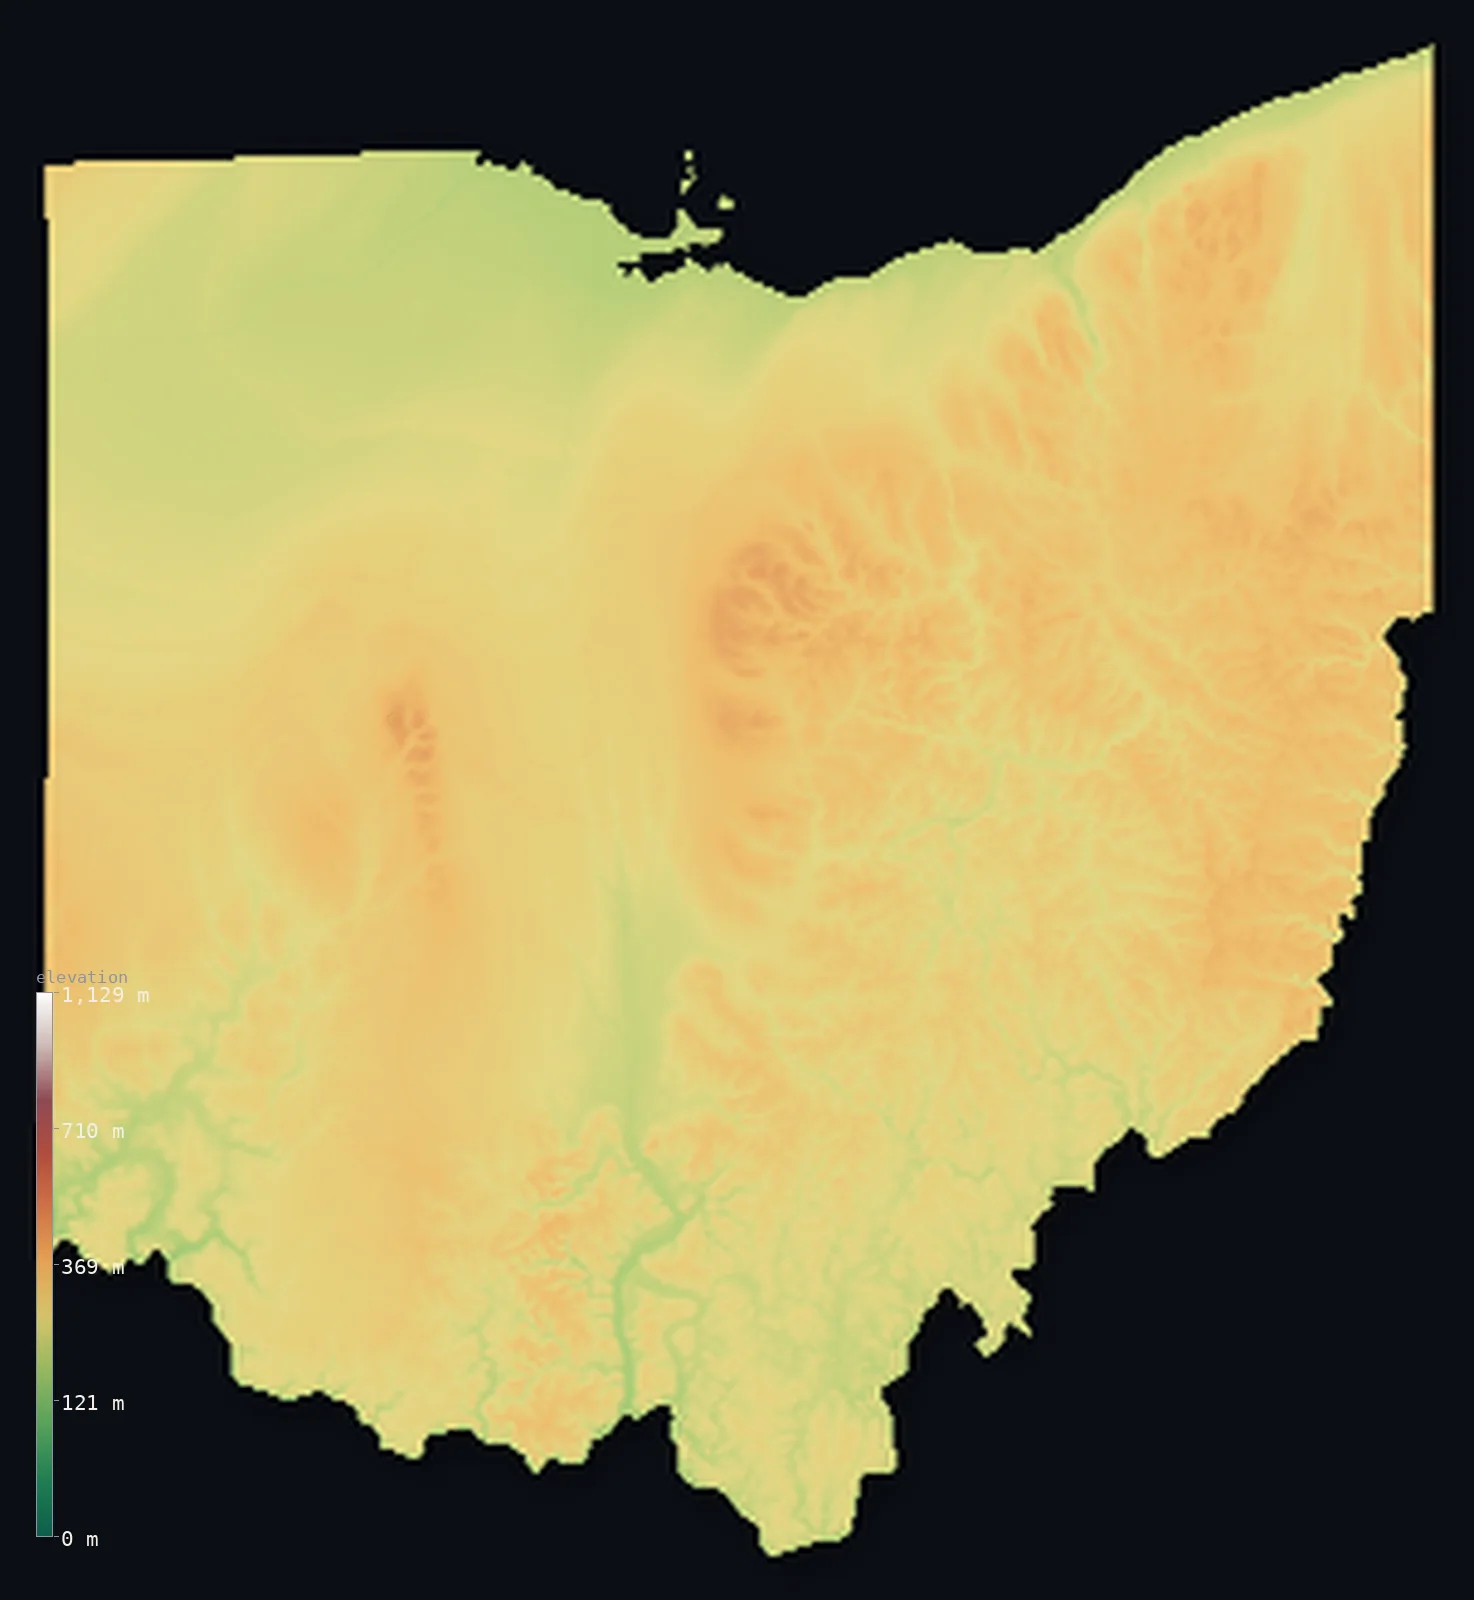
Ohio’s highest point is Campbell Hill at 1,549 ft (472 m); its lowest is Ohio River at 456 ft (139 m); the mean elevation is 935 ft (285 m).
- Highest point📚
- 1,549 ft472 m
- Campbell Hill.
- Lowest point📚
- 456 ft139 m
- Ohio River.
- Mean elevation⚙
- 935 ft285 m
- Computed from the GLO-30 surface model.
- Median elevation⚙
- 942 ft287 m
- Half of Ohio lies below this height.
- Elevation range📚
- 1,093 ft333 m
- From 139 m to Campbell Hill's 472 m.
- Official area📚
- 44,826 mi²116,098 km²
- Ohio.
Ohio at a glance
Campbell Hill, the high point, once hosted an Air Force radar station and is now a school campus.
source ↗Southeastern Ohio's Hocking Hills escaped glaciation, keeping rugged sandstone gorges the rest of the state lacks.
source ↗The glaciers that flattened western Ohio left it with some of the richest farm soil in America.
source ↗Ohio's whole relief spans only about 330 m, from Campbell Hill to the Ohio River.
source ↗The state is split between glaciated flatlands and the unglaciated Appalachian hills.
source ↗
Elevation profile of Ohio
The largest share of land, 18%, falls in the 275–300 m band, and 100% of the territory lies below 500 m (1,640 ft).
- below 500 m (1,640 ft)100%
Highest and lowest points
The highest point of Ohio, Campbell Hill, 472 m, a broad, gentle rise in the west-central farmland - so unassuming that it was once the site of an Air Force radar station, and now a vocational school.
source ↗Highest peaks of Ohio
| Peak | Elevation | Range | Note |
|---|---|---|---|
| Campbell Hill↗ | 1,549 ft472 m | Central Till Plains | Highest point of Ohio, a gentle rise. |
| Bellefontaine Outlier↗ | 1,509 ft460 m | Central Till Plains | High ground of the glacial outlier near Campbell Hill. |
| Appalachian Plateau highpoint↗ | 1,450 ft442 m | Allegheny Plateau | A high point of the unglaciated southeast. |
| Mohican highpoint↗ | 1,312 ft400 m | Glaciated Plateau | A high point of north-central Ohio. |
| Hocking Hills highpoint↗ | 1,247 ft380 m | Allegheny Plateau | High ground of the scenic Hocking Hills. |
Terrain regions of Ohio
Campbell Hill, the high point, once hosted an Air Force radar station and is now a school campus. ↗
The Appalachian Plateau
↗Southeastern Ohio is the Allegheny (Appalachian) Plateau, the only truly hilly part of the state - a region the glaciers largely missed, leaving rugged, foreste
The till plains
↗Western and central Ohio is flat to gently rolling till plain, flattened and enriched by the glaciers into some of the best farmland in the country. It holds Ca
The Lake Erie plain
↗Northern Ohio slopes gently to the flat lake plain along Lake Erie, the bed of a larger glacial lake - low, level, fertile ground holding Cleveland, Toledo and
The Appalachian Plateau
the southeastSoutheastern Ohio is the Allegheny (Appalachian) Plateau, the only truly hilly part of the state - a region the glaciers largely missed, leaving rugged, forested hills, steep valleys and the sandstone cliffs and gorges of the Hocking Hills. This is Ohio's most rugged and scenic country.
The till plains
the west and centreWestern and central Ohio is flat to gently rolling till plain, flattened and enriched by the glaciers into some of the best farmland in the country. It holds Campbell Hill (472 m), the state's modest high point, and the broad, fertile fields of the Corn Belt.
The Lake Erie plain
the north and south edgeNorthern Ohio slopes gently to the flat lake plain along Lake Erie, the bed of a larger glacial lake - low, level, fertile ground holding Cleveland, Toledo and the lakeshore, with the Ohio River forming the low southern border down to 139 m.
City elevations in Ohio
| City | Population | Elevation |
|---|---|---|
| Columbus | 913,175 | 761 ft232 m |
| Cleveland | 365,379 | 656 ft200 m |
| Cincinnati | 311,097 | 860 ft262 m |
| Toledo | 265,638 | 623 ft190 m |
| Akron | 197,542 | 961 ft293 m |
| Dayton | 135,512 | 745 ft227 m |
| Youngstown | 64,628 | 866 ft264 m |
| Lorain | 63,647 | 614 ft187 m |
| Springfield | 59,680 | 981 ft299 m |
| Huntington | 48,638 | 571 ft174 m |
Elevation sampled at each city centre from the Copernicus GLO-30 model. Cities and population from GeoNames (CC-BY 4.0).
Ohio in comparison
Ohio's terrain rises 1,093 ft (333 m) from Ohio River (456 ft (139 m)) to Campbell Hill — about 4% of the height of Mount Everest, the world's highest point at 29,032 ft (8,849 m).
Frequently asked questions
What is the highest point in Ohio?
- Campbell Hill, 1,549 ft (472 m).
What is the average elevation of Ohio?
- About 260 m according to the USGS; this page also reports the area-weighted mean computed from the Copernicus GLO-30 model, 935 ft (285 m).
What is the lowest point in Ohio?
- Ohio River, 456 ft (139 m).
Campbell Hill?
- Campbell Hill, the high point, once hosted an Air Force radar station and is now a school campus.
Where is the highest ground in Ohio?
- Southeastern Ohio is the Allegheny (Appalachian) Plateau, the only truly hilly part of the state - a region the glaciers largely missed, leaving rugged, forested hills, steep valleys and the sandstone
Is this a topographic, relief, contour, or elevation map of Ohio?
- They describe the same thing - terrain height. This page renders Ohio's actual elevation surface in interactive 3D (a relief or topographic view) and reports the statistics computed from it; a contour map shows the same data as lines of equal height.
About this map
The terrain is rendered from the Copernicus GLO-30 digital elevation model (ESA), masked to the US-OH boundary from geoBoundaries (gbOpen). Elevation statistics are computed directly from the model; peak names and researched facts are sourced and cited. See the methodology for the full pipeline.
Our area-weighted mean, computed from the Copernicus GLO-30 model, is 935 ft (285 m); the figure commonly cited elsewhere is 853 ft (260 m) (U.S. Geological Survey). Ohio's mean elevation is about 260 m; the page reports the area-weighted figure computed from the Copernicus GLO-30 model.
Surveyed national figures: official area · high point.
Rendered from Copernicus GLO-30 (ESA, 2021 release), boundaries from geoBoundaries. Generated 2026-07-14.