Vermont Elevation Map
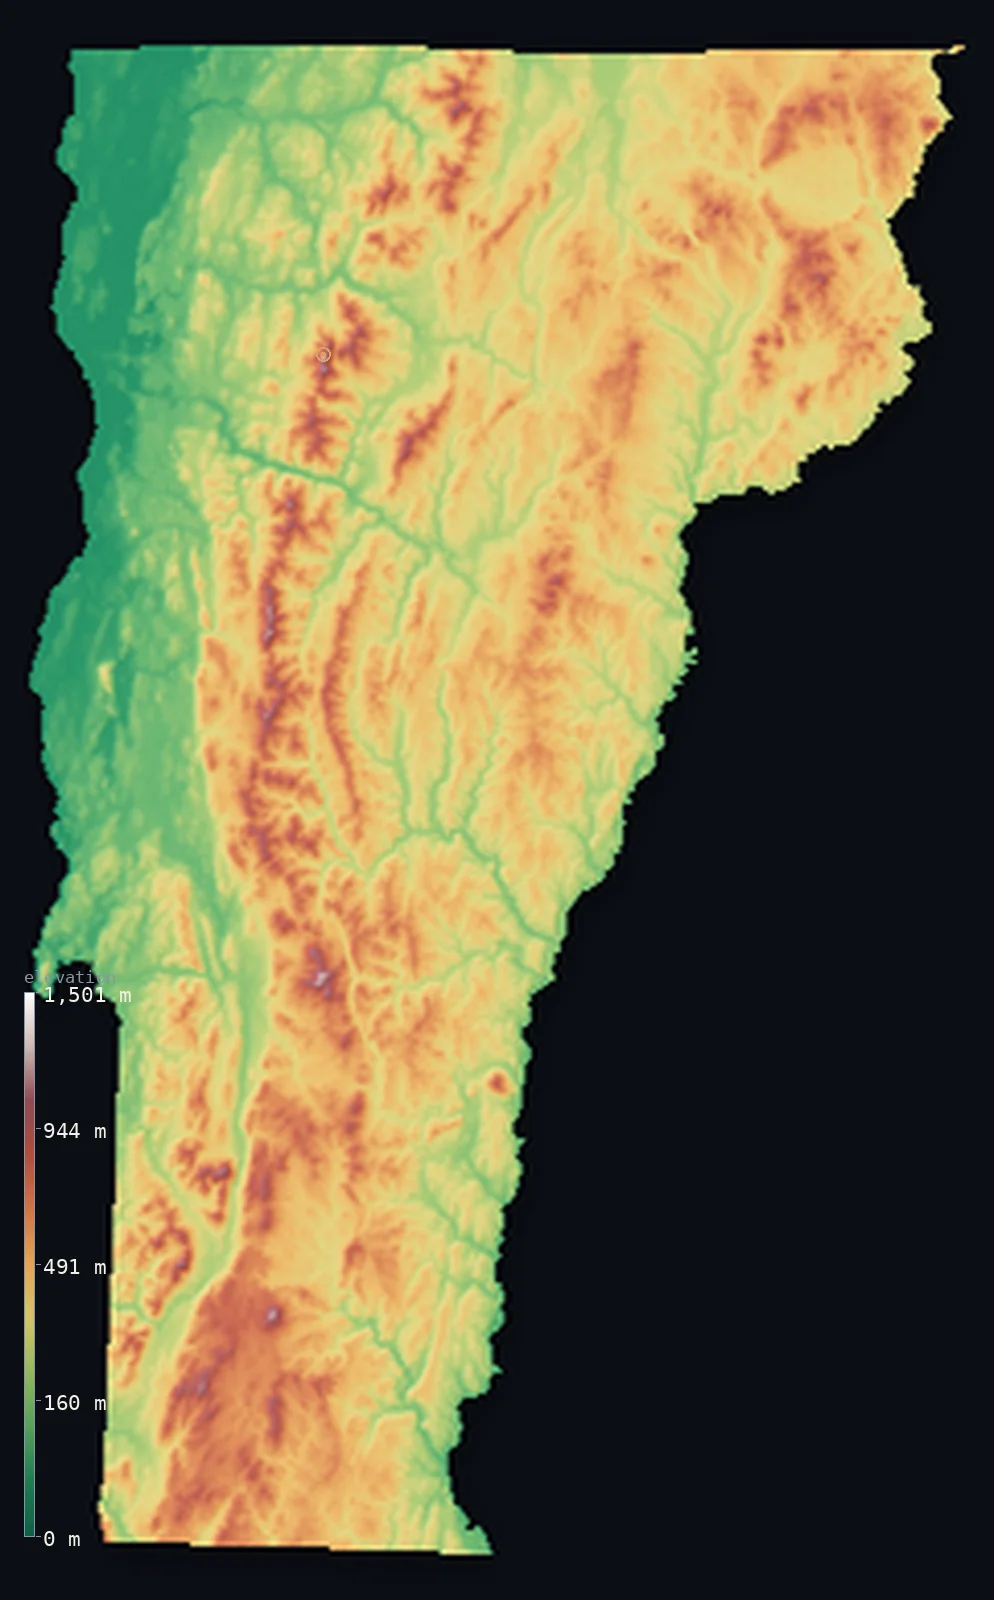
Vermont’s highest point is Mount Mansfield at 4,393 ft (1,339 m); its lowest is Lake Champlain at 95 ft (29 m); the mean elevation is 1,234 ft (376 m).
- Highest point📚
- 4,393 ft1,339 m
- Mount Mansfield.
- Lowest point📚
- 95 ft29 m
- Lake Champlain.
- Mean elevation⚙
- 1,234 ft376 m
- Computed from the GLO-30 surface model.
- Median elevation⚙
- 1,224 ft373 m
- Half of Vermont lies below this height.
- Elevation range📚
- 4,298 ft1,310 m
- From 29 m to Mount Mansfield's 1339 m.
- Above 1,000 m (3,281 ft)⚙
- <1%
- The state's higher ground.
- Official area📚
- 9,616 mi²24,906 km²
- Vermont.
Vermont at a glance
Mount Mansfield's ridgeline is said to resemble a face, with summits named the Chin, Nose and Forehead.
source ↗A few of Vermont's highest peaks rise above treeline into rare fragile alpine tundra.
source ↗Vermont is the most rural state in the nation by share of population.
source ↗Lake Champlain, Vermont's lowest point, is sometimes called the sixth Great Lake.
source ↗The Green Mountains run unbroken the entire length of the state.
source ↗
Elevation profile of Vermont
The largest share of land, 20%, falls in the 300–400 m band, and 75% of the territory lies below 500 m (1,640 ft).
- below 500 m (1,640 ft)75%
- 500–1,000 m25%
- 1,000–2,000 m<1%
Highest and lowest points
The highest point of Vermont, Mount Mansfield, 1,339 m, the high summit of the Green Mountains - its long ridgeline said to resemble a human face in profile, with named summits called the Chin, Nose and Forehead.
source ↗Highest peaks of Vermont
| Peak | Elevation | Range | Note |
|---|---|---|---|
| Mount Mansfield↗ | 4,393 ft1,339 m | Green Mountains | Highest point of Vermont, its ridge shaped like a face. |
| Killington Peak↗ | 4,229 ft1,289 m | Green Mountains | The second-highest peak in Vermont, a major ski mountain. |
| Mount Ellen↗ | 4,081 ft1,244 m | Green Mountains | A high peak of the central Green Mountains. |
| Camels Hump↗ | 4,081 ft1,244 m | Green Mountains | An iconic bare-topped peak, a state symbol. |
| Mount Abraham↗ | 3,937 ft1,200 m | Green Mountains | A high summit with a rare alpine zone. |
Terrain regions of Vermont
Mount Mansfield's ridgeline is said to resemble a face, with summits named the Chin, Nose and Forehead. ↗
The Green Mountains
↗The spine of Vermont is the Green Mountains, running the length of the state north to south - a range of rounded, forested peaks crowned by Mount Mansfield (1,3
The valleys and eastern hills
↗East and west of the main range lie Vermont's valleys and lower hills - the Connecticut River valley along the New Hampshire border, the piedmont hill country,
The Champlain Valley
↗In the northwest, the land drops to the broad, fertile Champlain Valley along Lake Champlain, the state's lowland farm country and its lowest point at 29 m - a
The Green Mountains
the centre spineThe spine of Vermont is the Green Mountains, running the length of the state north to south - a range of rounded, forested peaks crowned by Mount Mansfield (1,339 m), the state's highest. A few summits rise just above treeline into rare alpine tundra, and the range's snows built Vermont's ski country.
The valleys and eastern hills
the east and southwestEast and west of the main range lie Vermont's valleys and lower hills - the Connecticut River valley along the New Hampshire border, the piedmont hill country, and the Taconic Mountains in the southwest, all rolling, forested and green.
The Champlain Valley
the northwestIn the northwest, the land drops to the broad, fertile Champlain Valley along Lake Champlain, the state's lowland farm country and its lowest point at 29 m - a flat, open basin between the Green Mountains and the Adirondacks across the lake in New York.
City elevations in Vermont
| City | Population | Elevation |
|---|---|---|
| Burlington | 42,452 | 207 ft63 m |
| Rutland | 15,824 | 650 ft198 m |
| Hartford | 9,779 | 394 ft120 m |
| Bennington | 9,074 | 689 ft210 m |
| Barre | 8,746 | 614 ft187 m |
| St Johnsbury | 7,571 | 623 ft190 m |
| Brattleboro | 7,414 | 279 ft85 m |
| Saint Albans | 6,918 | 423 ft129 m |
| Middlebury (village) | 6,588 | 364 ft111 m |
| Morristown | 5,653 | 755 ft230 m |
Elevation sampled at each city centre from the Copernicus GLO-30 model. Cities and population from GeoNames (CC-BY 4.0).
Vermont in comparison
Vermont's terrain rises 4,298 ft (1,310 m) from Lake Champlain (95 ft (29 m)) to Mount Mansfield — about 15% of the height of Mount Everest, the world's highest point at 29,032 ft (8,849 m).
Frequently asked questions
What is the highest point in Vermont?
- Mount Mansfield, 4,393 ft (1,339 m).
What is the average elevation of Vermont?
- About 300 m according to the USGS; this page also reports the area-weighted mean computed from the Copernicus GLO-30 model, 1,234 ft (376 m).
What is the lowest point in Vermont?
- Lake Champlain, 95 ft (29 m).
Mount Mansfield's ridgeline is said to resemble a face?
- Mount Mansfield's ridgeline is said to resemble a face, with summits named the Chin, Nose and Forehead.
Where is the highest ground in Vermont?
- The spine of Vermont is the Green Mountains, running the length of the state north to south - a range of rounded, forested peaks crowned by Mount Mansfield (1,339 m), the state's highest. A few summit
Is this a topographic, relief, contour, or elevation map of Vermont?
- They describe the same thing - terrain height. This page renders Vermont's actual elevation surface in interactive 3D (a relief or topographic view) and reports the statistics computed from it; a contour map shows the same data as lines of equal height.
About this map
The terrain is rendered from the Copernicus GLO-30 digital elevation model (ESA), masked to the US-VT boundary from geoBoundaries (gbOpen). Elevation statistics are computed directly from the model; peak names and researched facts are sourced and cited. See the methodology for the full pipeline.
Our area-weighted mean, computed from the Copernicus GLO-30 model, is 1,234 ft (376 m); the figure commonly cited elsewhere is 984 ft (300 m) (U.S. Geological Survey). Vermont's mean elevation is about 300 m; the page reports the area-weighted figure computed from the Copernicus GLO-30 model.
Surveyed national figures: official area · high point.
Rendered from Copernicus GLO-30 (ESA, 2021 release), boundaries from geoBoundaries. Generated 2026-07-14.